The Dashboard is the "home" window that opens by default with your login to Salsa Engage. It features an overview of Salsa Engage activity.
Dashboard: Welcome
This is what your dashboard will look like after your initial account setup is complete.

This page displays many shortcuts that enable you to get started quickly, such as the following:
- Send an email.
- Post something to social media.
- Build a fundraising form.
- Build a targeted action.
- Grow your list.
- Make a petition.
You can click the Don't show me this again × button in the top right to make the Snapshot tab display first instead of this Welcome tab every time you log in.
Dashboard: Account Snapshot
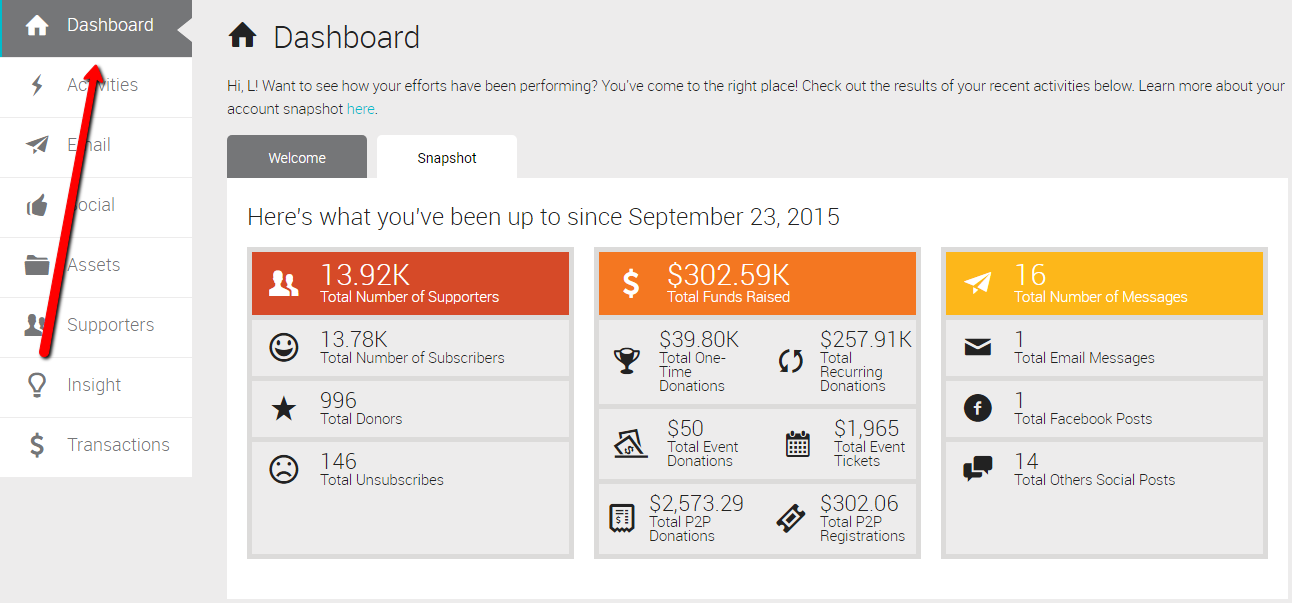
The Snapshot tab displays fundamental statistics about your overall activities in Engage since you started.

The first set of stats are your total number of supporters in your account, broken into how many subscribers you have (folks who aren’t unsubscribed) and how many supporters have donated.
You will also see the total amount of funds raised since your account was created, broken out into one-time and recurring donations.
The last lifetime stat is how many messages have been sent, this is broken out into email and social posts.
Below these lifetime stats, you will see summaries of your activity by date range, with the ability to change the timeframe (30 days, 90 days, 1 year, or Lifetime) that the graphs display.
If you have a specific date range you want to filter by clicking the date dropdown and select the range of days and click Apply.
Data by Date Range
Below the overview, you'll find some additional statistics about specific aspects of your account.
- Email Blasts - The total number of emails sent in the time range you specified. It will also give you a total of clicks and conversions for all emails sent in the time range.
- Social Posts - The total number of Social Posts published in the time range you specified. It will also give you a total of clicks and conversions for all Social Posts published in the time range.
- New Subscribers - The total number of new subscribers added to your account in the time range you specified. It will also give you the total number of unsubscribes that occurred and how many supporters updated their subscription options.
- Amount Raised - The total amount raised for the timeframe you selected. This is split into amounts raised by returning donors vs. new donors.
- Event Funds Raised - The total amount raised from Event Activities, from registrations and donations, for the timeframe you selected.
- P2P Funds Raised - The total amount raised from P2P Activities, from registrations, donations, and purchases, for the timeframe you selected.
- Targeted Actions - The number of messages sent and engaged supporters for the timeframe that you selected. Engaged supporters represent the number of supporters who started an action (regardless of how many targets they contacted).
- Petitions - The number of signatures and comments you've received on Petitions that you have published for the timeframe that you selected.
To toggle on/off specific stats in the graphs click the colored box next to the stat you want to toggle.
To get specific details for a point on the graph hover your mouse over the spot on the graph.
Favicon
Please see this article on updating the Look & Feel of your Engage forms and emails.