
Salsa Engage Insights provides statistics to enable you to see how well you are doing in terms of messaging and activities.
Getting Started
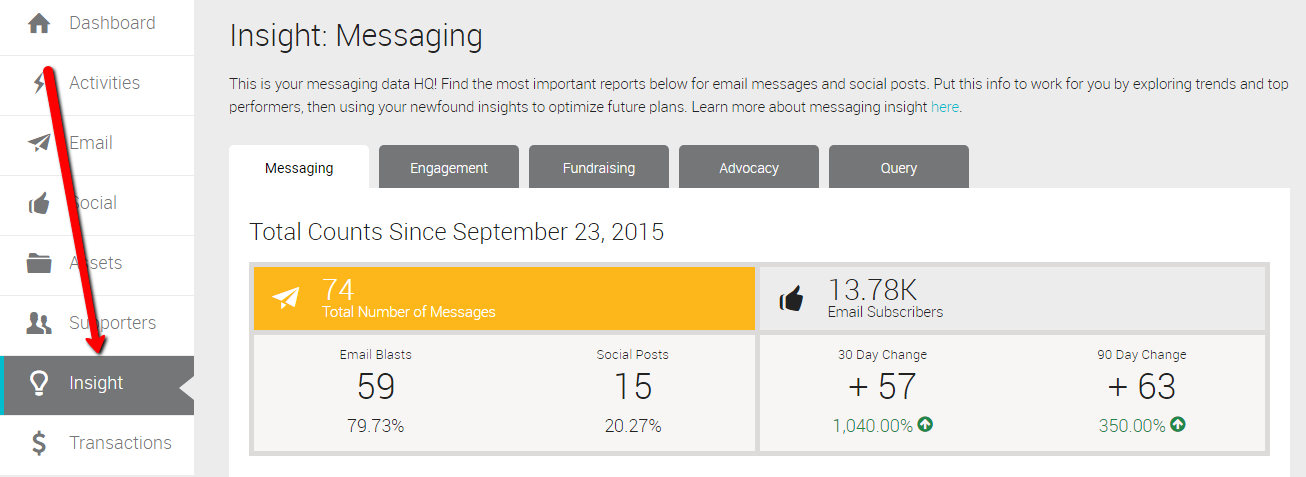
Click on the Insight module on the left column. Messaging tab will be open by default. Click the tab that you are interested in.
Insights by Date Range
Total counts at the top of each tab are indicative of account performance for your organization since your account start date.
Underneath that section, you will see several graphs. The 30d, 90d, 1y and ALL buttons will automatically filter the information included in the graphs by those timeframes.
Note: All of the information in this section is limited by date range.
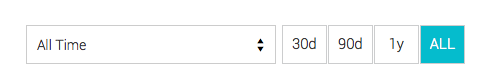
If you have a specific date range you want to filter by clicking the date drop-down and select the range of days and click Apply.
You can modify what information is returned for some of the graphs by clicking the legend.
Messaging Insight
Total Number of Messages shows how many Emails vs. Social Posts you have published in the entire life of your account and gives a percentage breakdown.
Email Subscribers gives you several key data points:
- The total number of people who are currently signed up to receive your emails
- 30 Day Change: The number and percent increase or decrease in email subscriptions over the last 30 days.
- If the number and percentage are positive, it means your net subscribe rate is outpacing your net unsubscribe rate (and your emailable list size is growing).
- If the number and percentage are negative, it means your net unsubscribe rate is outpacing your net subscribe rate (and your emailable list size is shrinking).
New Subscribers - Total new subscribers added to your list, how many unsubscribes, and the unsubscribe rate as a percent.
Emails Sent - How many emails have been delivered to your supporters and the number of hard bounces.
Subscriber Engagement - A snapshot of how engaged your supporters are based on how many emails they opened, emails they clicked, and the donations they made. If a supporter opens or clicks an email or makes a donation within the selected timeframe, he will be considered an engaged subscriber. If he hasn't done any of those things, he will be counted in the inactive subscribers section.
Published Messages - How many Email Blasts and Social Posts were sent/published.
Emails Delivered - The number of opens, clicks, and conversions. A Conversion is when a supporter who received an email went on to complete a form linked in your email (such as a signup or donation form).
Published Social Posts - How many clicks and conversions occurred from social posts that have been published. A Conversion is when a supporter who saw your social post went on to complete a form linked in your post (such as a signup or donation form).
Top Email Messages - Top 10 Email Messages based on Open, Click, and Conversion Rates.
Top Automated Messages - Top 10 Email Series based on Open, Click, and Conversion Rates.
Engagement Insight
Total Number of Supporters - The number of people who are signed up as supporters of your organization since your account start date.
Total Number of Subscribers - Of the total number of supporters, how many are subscribed to receive emails from you.
Total Donors -Of the total number of supporters, the total number of donors who have made donations to one of your Activity Forms.
New Subscribers - In the timeframe specified, how many subscribers were newly created (with a unique email address) from sign-up forms, fundraising forms, or petitions you've created.
Supporter Actions - The total number of actions by supporters across activity types.
Summary - Compares common engagement metrics over time, such as New Supporters, New Subscribers, New Donors, Donations added, and Petition signatures.
Top Sign-up Forms - Use the drop-down control to find your top Sign-up forms by Page Views or Signups.
Top Fundraising Forms - On the Fundraising tab, use the drop-down control to find your top fundraising forms by Number of Donations, Total Funds Raised, Page Views, Conversion Rate, or Abandon Rate. On the Engagement tab, select Number of Donations, Total Funds Raised, or Page Views.
Top Petitions - On the Advocacy tab, use the drop-down control to find your top petitions by Page Views, Total Conversions, or Total Conversion Rate. On the Engagement tab, select Page View, Total Signatures, or Total Comments.
Fundraising Insight
Total Funds Raised - The total amount of funds raised for your organization since your account start date.
Total Number of Donations - The total count of donations added for your organization since your account start date.
Total Donors - The total number of donors who made donations to your organization since your account start date.
Funds Raised by Donor Type - The amount of money that was raised by new or returning donors.
Funds Raised by Donation Type - The amount of money that was raised by one-time or recurring donations.
Average Donation Amount - Average donations for returning donors and new donors compared with the cumulative organization average.
Number of Donors - The count of new and returning donors.
Number of Donations - The count of donations that are recurring or one time.
Number of Donations by Date - The total donation count by new or returning donors made to your organization sorted by date received.
Fundraising Trends - The amount you've raised, number of donations, and average donation amount by day.
Top Fundraising Forms - On the Fundraising tab, use the drop-down control to find your top fundraising forms by Number of Donations, Total Funds Raised, Page Views, Conversion Rate, or Abandon Rate. On the Engagement tab, select Number of Donations, Total Funds Raised, or Page Views.
Advocacy Insight
Advocating Supporters - The total number of supporters who acted on behalf of your cause since your account start date.
Supporters Who Signed Petitions - The number of supporters who signed petitions since your account start date.
Supporters Who Sent Messages - The number of supporters who supported your cause by sending an email or posting to social since your account start date.
Petition Signatures - The number of signatures that you've gotten.
Messages Sent - The number of messages sent, by channel; compares new to existing supporters.
Message Targets - Number of targets that received messages sent by new or existing supporters.
Total Petition Views - The number of total or unique times your active petitions have been viewed.
Total Targeted Action Form Views - The number of times that your targeted action has been viewed.
Conversions - How many people successfully submitted Petitions or Targeted Actions.
Timeline - Compares common advocacy metrics for Petition Signatures, Petition Comments, Targeted Actions Sent, and Targeted Action Supporters.
Top Petitions - Top petitions based on Page Views, Total Conversions, or Total Conversion Rate.
Top Targeted Action Forms - On the Advocacy tab, use the drop-down control to find your top targeted action forms by Page Views, Total Conversions, or Total Conversion Rate.