
The Word Processing screen has a Report Wizard in addition to the Mail Merge Wizard. The Report Wizard allows customers to run a query and then use the output to print a formatted report. There are two main types of report:
- The first type provides the ability to include all of your query data into one large formatted table.
- Control Break Reports allow you to break your report into sections based on groupings of any column (such as City, State, Zip Code, or Group).
To use the Report Wizard...
- From the main Salsa CRM menu, choose Manage, Documents, and then Word Processor.
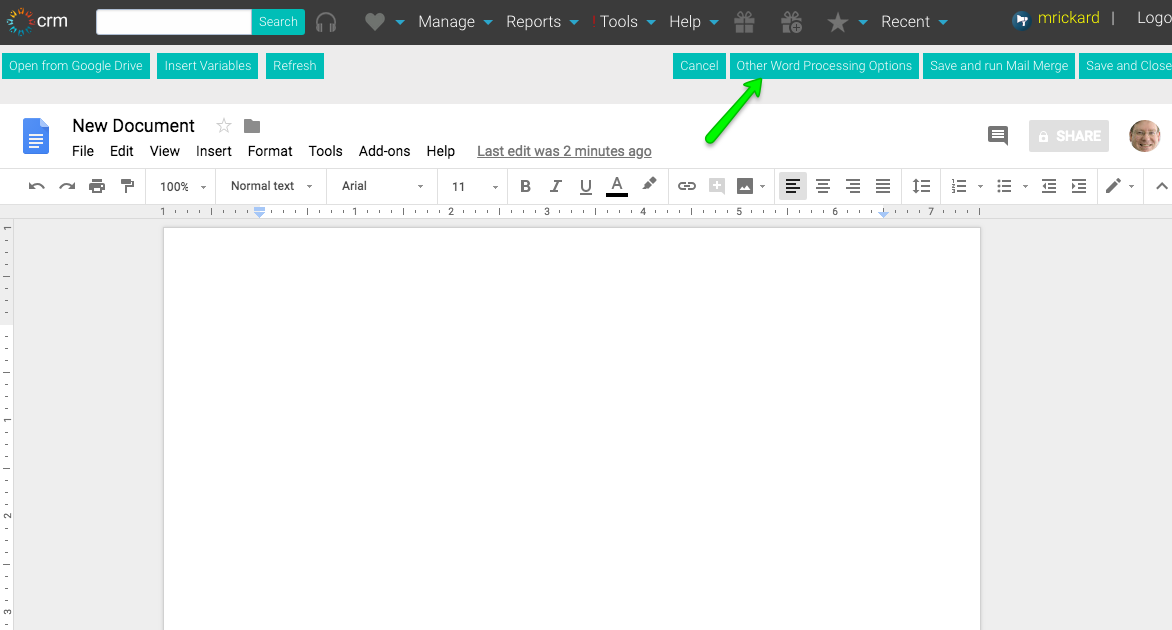
- From the Google Docs New Document window, select the Other Word Processing Options button.
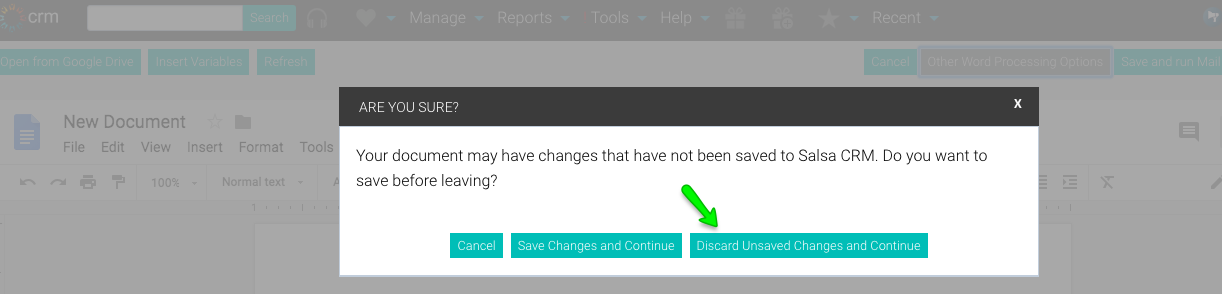
- Discard Unsaved Changes made so far to the blank, new document and continue.
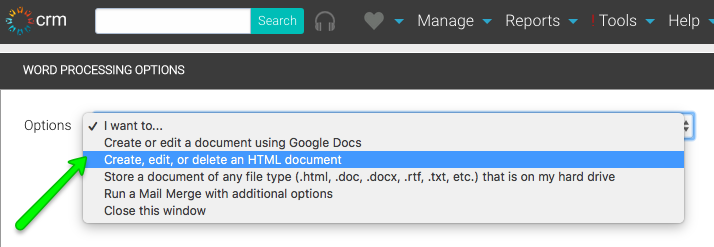
- On the Word Processing Options screen, select Create, Edit, or Delete an HTML Document.
- On the built-in Word Processor screen, select the Query Wizards button
- Select Display Report Wizard. The Report Wizard will display on the right side of your screen and guide you through the necessary steps of generating a report.

- Choose the Open or run a Query button at the top of the Report Wizard panel.
- See the Queries section of Help for instructions on setting up and running a query. Note: The order of the query options output is how the information will appear on the final formatted report. Sort the information in the query as to how you want it to appear in the final report.
- On the last step of the query, choose the Finish You will return to the Word Processor screen. Below the Open or Run a Query button will be the number of records your query returned.
- At the bottom of the Report Wizard panel, choose Next and then Next
- Insert the desired variables for your report. Instead of typing things like today's date, double click on Today's Date under Common Variables. Salsa CRM will insert {{Today's Date}} at the location of your cursor. When you print the report the variable {{Today's Date}} will be replaced by the actual date.
- To include all of your query data into one large formatted table insert the variable {{All Data With Border}} or {{All Data Without Border}} at the beginning of the report and the information will be displayed with or without a border.
- To sum a column of data using the Grand Total function place the variable {{Grand Total Columns}} on its own line, and every column variable placed after it on that line will be summed in the last row of the table.
- To break your report into sections based on groupings of any column (such as City, State, Zip Code, Group) use the Control Break Place the variable {{Control Break Fields}} on a line by itself, and every field listed after it will be part of the grouping criteria. Grand Total Columns also works in conjunction with Control Break reports, and the totals will display at the end of every group. A Grand Total Amount will be displayed for every column specified at the bottom of the document.
- The above variables will create the following report:
- After you have inserted all of the information for your report, select
- Select View Report in Browser and an image similar to the above report will appear.
- Right-clicking in your browser allows you to print the report or copy to Excel.