This section covers Insight metrics that are available for Activities in Engage. You may collapse or expand the statistics and graphs at the top of the page by clicking the arrow next to each Activity's Insight header.
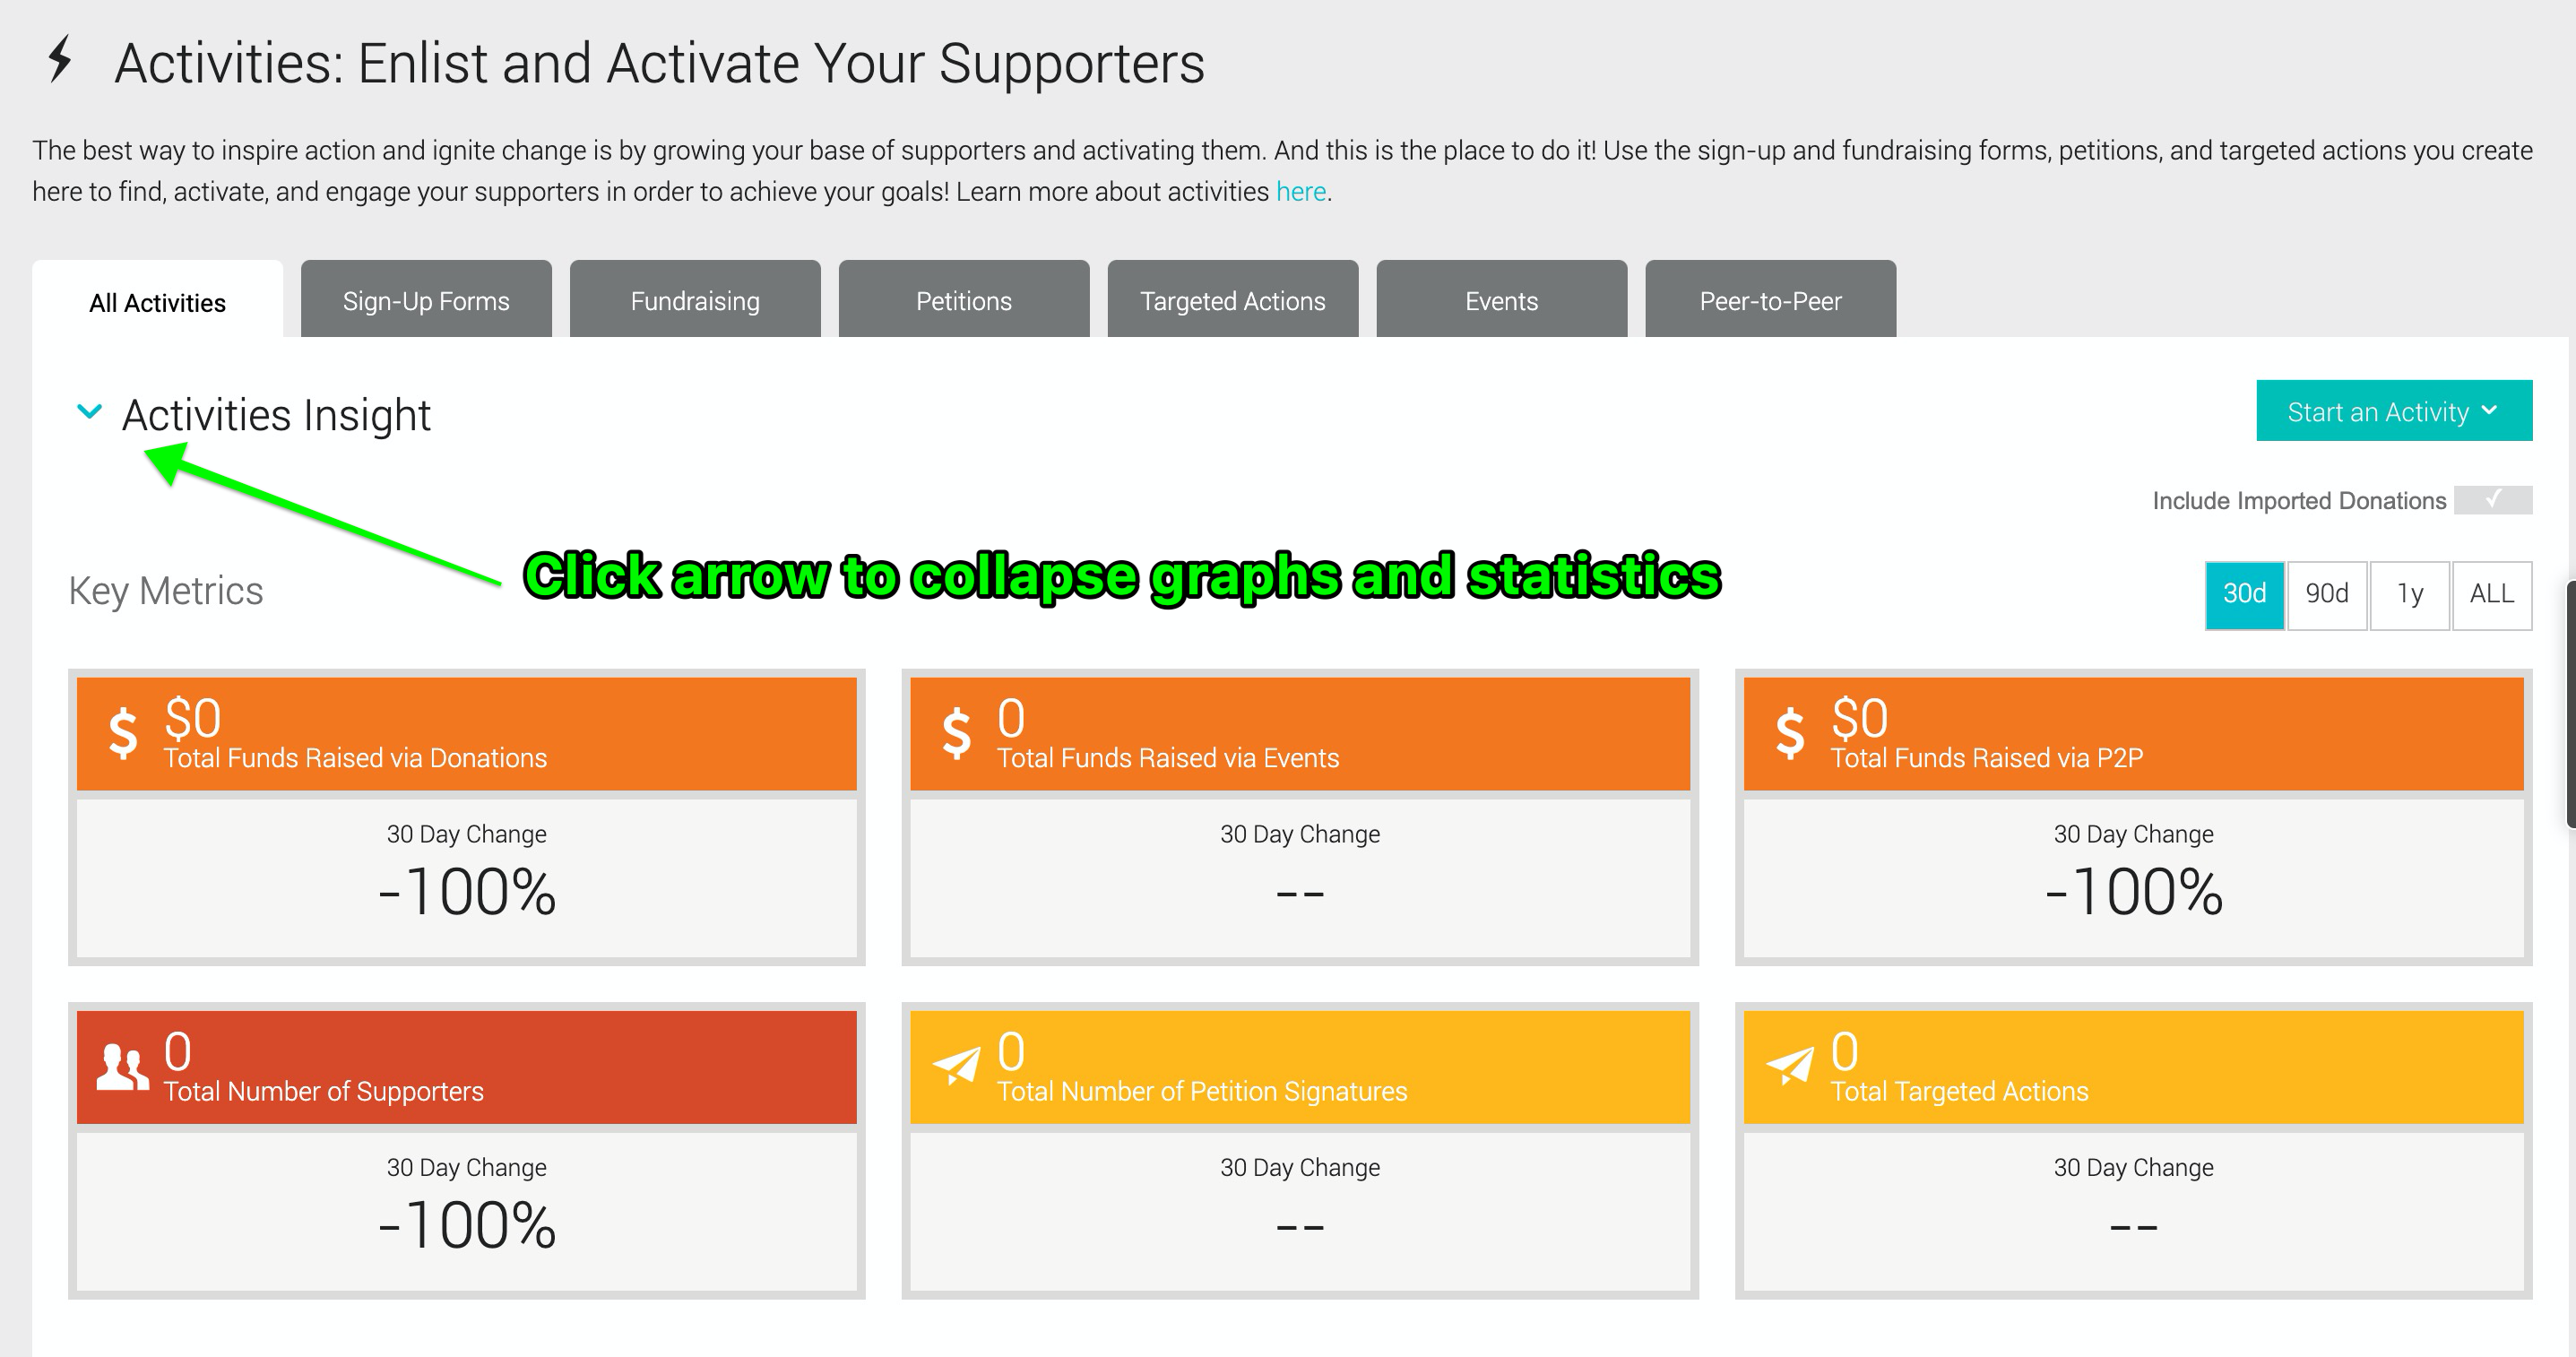
Note that not all of the following statistics are available for every activity. Statistics are in alphabetical order.
Attempts Unable to Call due to the Budget Cap—This is the number of Click To Call supporters who would have made calls if funding had still been available.
Average Connection Duration—The total duration of completed Click To Call target calls divided by the total count of target calls.
Budget Remaining—The amount of Click To Call budget left to pay for supporter calls to targets.
Call Results—A breakdown of the number and percentage of Click To Call calls that were completed, canceled, not answered, skipped, etc.
Conversions—The Conversions Report shows you the number of conversions (the number of people who submitted the sign-up form) side by side with the number of total page views. To calculate your conversion rate, simply divide: conversions divided by page views.
Conversions by Source—Where registrants or donors are coming from:
- Referrals—Traffic to your form from another source.
- Direct—Traffic where the referrer or source is unknown.
- Organic—Traffic from search engine results that is earned, not paid.
- Email—Traffic that originated from clicking a link in Engage email.
- Social—Traffic that originated with an Engage social post.
- Other—Traffic does not fit into another source or has been tagged as “Other” via a URL parameter.
CRM Integration Details—For clients using Salsa CRM, all the form fields with data entered are synced automatically to the CRM. Clients can log in to their CRM, search on a Supporter Last Name, then see their Profile, click into Activities to see a list, then click into the record to open the actual back end of the form in Engage that that supporter came from.
Date Filter—The date range you set at the top of the page, affects every report on the page. (Although the screenshot below shows the date range for Petitions, the control works the same way in all Activities and Messages.

Eligible action takers—Supporters who were qualified to take action.
Email Opt-ins—If you've left the option to opt into email blasts, this will tell you the breakdown of those who chose to do so and those who did not. Again, if you hover your mouse over the pie slices, you'll see a percentage along with the total.
Funds Raised By Type—Subtotals of event registrations, purchases, and donations.
Ineligible due to location—Supporters who wanted to take action but couldn't because they are not part of the eligible demographic. For example, a supporter will not be able to take action if he is not in the congressional district of the congressmen that you are aiming to reach.
Messages by Channel—The number of messages broken down by how many were sent for each channel (Click To Call, email, Twitter).
Messages Sent—The total number of messages sent, broken out by new and existing supporters. Hover your mouse over the pie slices to see a percentage.
Messages by Target Set—The number of messages broken down by how many were sent for each target set. For example, if Rep A has Twitter and Email, and Rep B has only an Email, and you submit an action, Messages = 3, and Targets Contacted = 2.
New Subscribers—The New Subscribers Report tells you how many people opted in to receive your communications via this particular sign-up page.

New Supporters by Source—The sources of new page views.
Page Views by [Conversion] Source—This information enables you to see which Targeted Actions are best at driving valuable customer activity.
Page Views by Device—What types of devices supporters are using to view your content.
Page Views by Source—Where page views are coming from.
Page Views Over Time—Daily aggregate and unique page views of your event.
Subscription Opt-Ins—Supporters have the option to opt into subscriptions via the petition form if you've allowed those options. You can see a count of the total number of supporters who opted into particular subscription preferences via this petition. Filter by existing and new supporters.

Supporter Calls—The number of supporters who initiated Click To Call.
Supporters Engaged—How many supporters have tried to take action.
Target Calls—The count of all completed calls for the Click To Call Targeted Action.
Targets Contacted by Target Set—The number of messages broken down by target set. For example, if Rep A has Twitter and Email, and Rep B has only an Email, and you submit an action, Messages = 3, and Targets Contacted = 2.
Team vs. non-Team Donation Averages—Average dollar comparisons for individual fundraisers who joined or did not join a team.
Timeline—This graph gives you a quick, visual representation of your form's performance over time, but you can reveal a great deal of data that is broken out above in the individual statistics boxes. Just hover your mouse pointer over the graph, and see data points such as "unique page views", "subscription opt-ins", etc. Need to see the specific dates? The mouse-over window will show that, too.
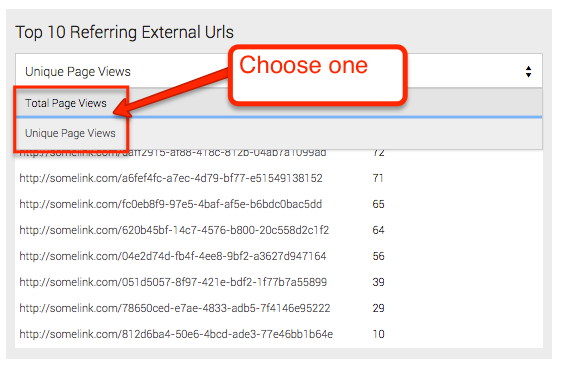
Top 10 Referring Urls—How are people finding this sign-up page? Are you coming straight from a Google search or from your home page? This report gives you a ranked list of the web pages which are driving more traffic to this particular sign-up form than any other page. Filter these results to see which web pages are driving specific types of traffic to this sign-up form:
- Unique Page Views—An unduplicated count of people coming to this page (i.e. if one person viewed the sign-up page three times that would count as one page view)
- Total Page Views—A duplicated count of people coming to this page (i.e. if one person viewed the sign-up page three times that would count as three page views)
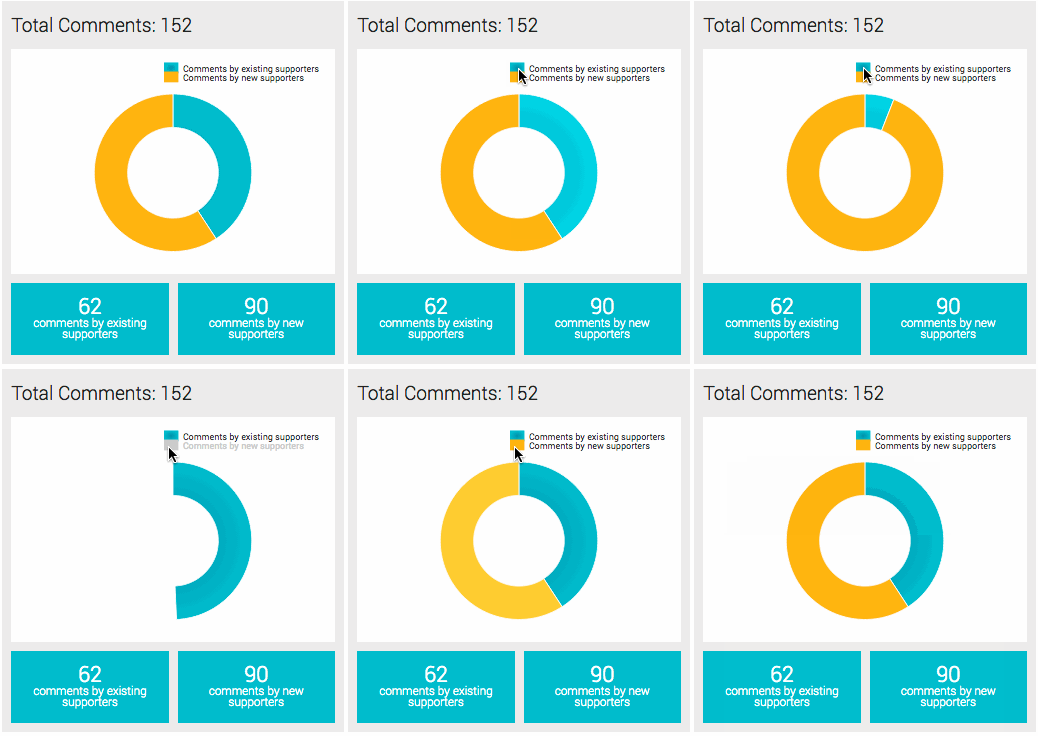
Total Comments—See a count of the total number of comments for this petition. Click the key to filter the comment count by existing vs. new supporters.
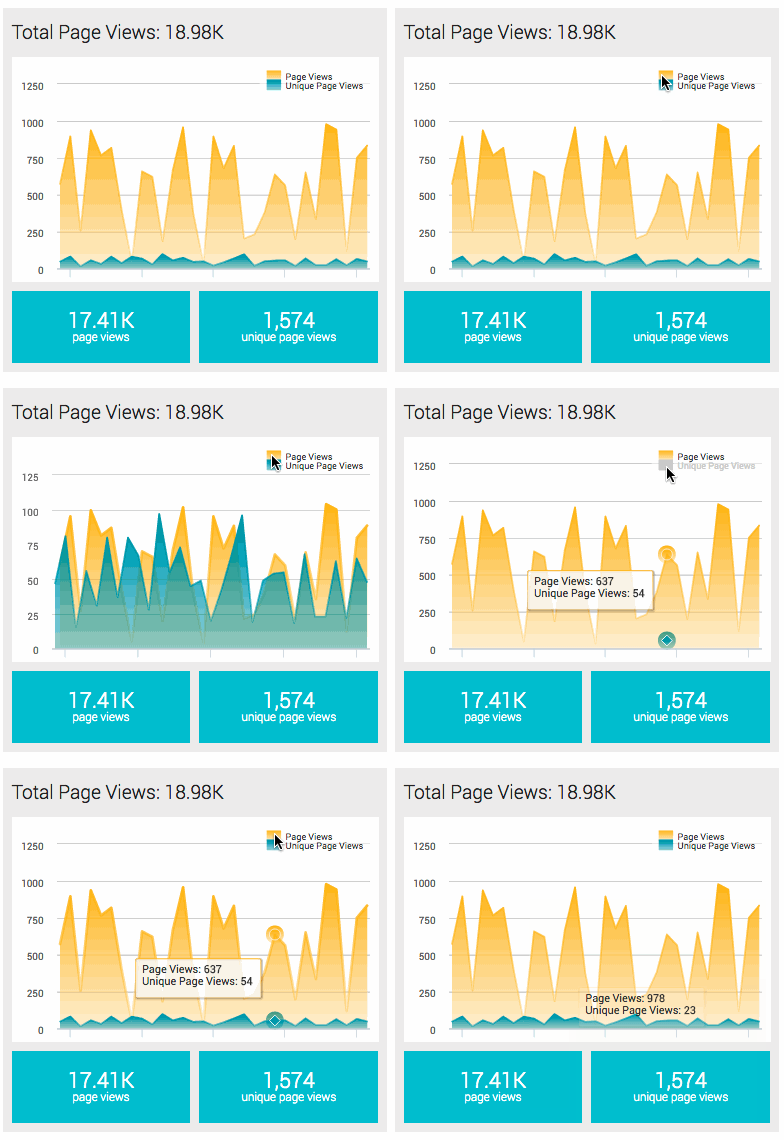
Total Page Views—See and compare the total number of times this page has been viewed by any user. To be counted here, people don't have to do anything but look at the page—they don't have to fill out the sign-up form.
- Total page views may be a duplicated count (in other words, if one person viewed the sign-up page three times that would count as three page views).
- Unique page views are an unduplicated count (in other words, if one person viewed the sign-up page three times that would count as one unique pageview).
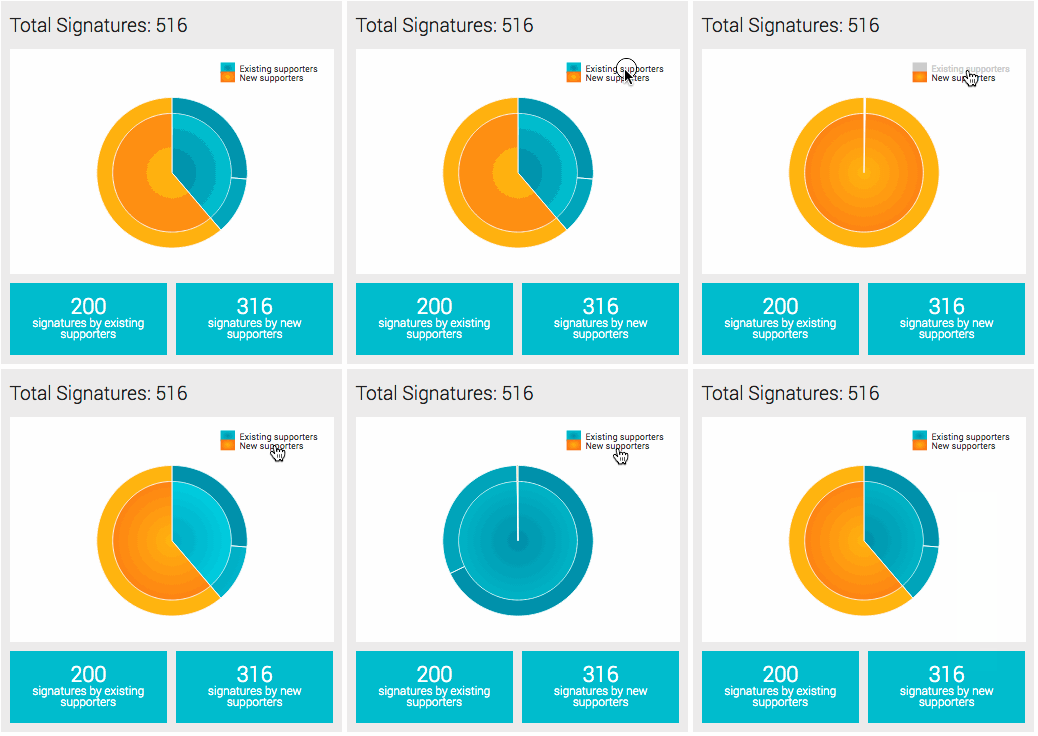
Total Signatures—See a count of signatures for this petition. Click the key to filter the signature count by existing vs. new supporters
Tracking Codes—See the number of page views and conversions for that activity, based on tracking codes embedded in the form URL.